Maybe you've already heard it: There's a new language on the block - Julia. She seems to be a hot contender for the new standard scientific computing language, maybe also replacing R for statistical analysis.
Julia is a high-level, high-performance dynamic programming language for technical computing, with syntax that is familiar to users of other technical computing environments. It provides a sophisticated compiler, distributed parallel execution, numerical accuracy, and an extensive mathematical function library.
Of course, it's a very young language, so they standard library is quite small right now. For example, you can also plot to the webinterface, not to real image files. That wasn't enough for me, so I set out to create my own small plotting interface.
Like the rest of Julia, it's very easy to use, just a few characters to plot something:
1 | |
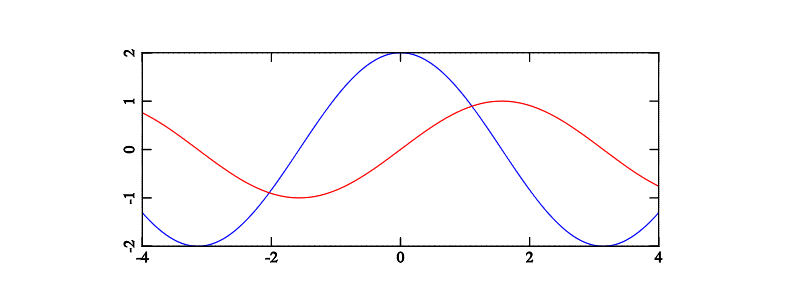
If you wanted a more elaborate plot, you'd do this:
1 2 3 4 5 6 7 8 9 10 | |
It's based on [cached]MathGL, an awesome plotting library for C/C++. As usual, [cached]the source is on GitHub, so feel free to contribute :)
Tags: programming, graphics